Okanagan Water Viewer
The Okanagan Water Supply and Demand Viewer is a web-based, spatial tool that provides access to the wide range of water use and availability data, modelling and analysis results generated by the Okanagan Water Supply and Demand Project.
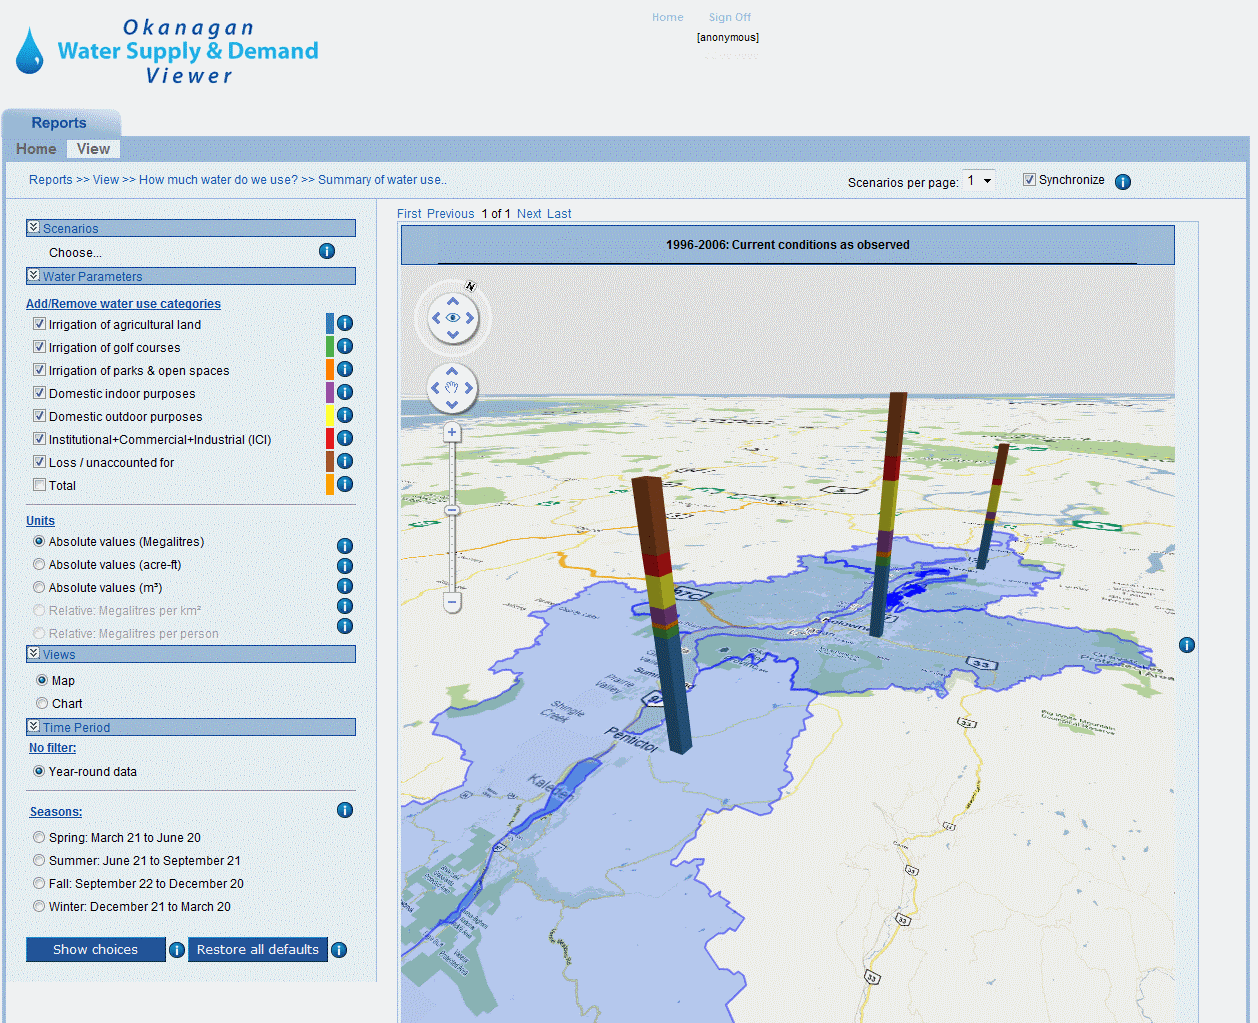
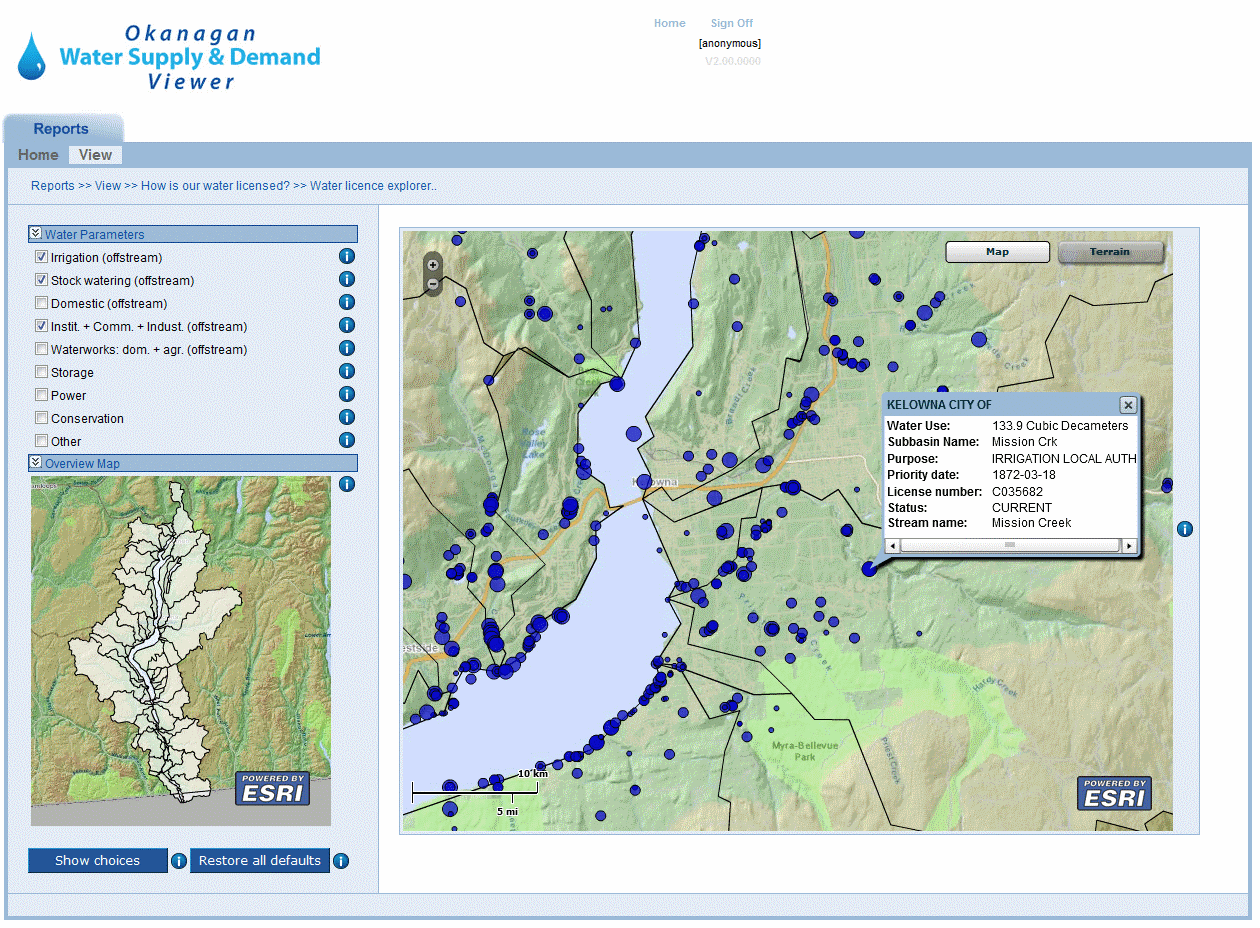
 The system uses visualization tools (graphs and maps) to illustrate current and future conditions of water use, availability, in-stream flow needs and water licensed for different uses.
The Viewer offers cutting-edge web-enabled GIS features that allow question-based discovery of Okanagan water availability information. One example is the dynamic interactive 3D map which display 3D bars for each sub-basin overlaid on a Google Earth interface.
Without this system, Water Supply and Demand data would be “locked” inside custom desktop models that only a handful of people have the expertise to operate, and in voluminous paper reports.
Technologies used included ArcGIS Server, Google Maps API, Google Charts API, SQL Server 2008, and VB.NET.
Keywords & Themes: Water resources / Data management / Integrated data / Web application / Geospatial tools / Science communication / Data visualization / Dashboards / Time-series roll-up / Fisheries resources